“Blue states hand out welfare like candy, red states expect people to work!”
I’ve heard this argument from both sides. I’ve heard blue states are the welfare states, I’ve heard red states are the welfare states, but most importantly, I’ve heard that Minnesota specifically is a problematic state for welfare programs..so which is it? What’s true?
To tackle this question, I first started by using the 2020 Decennial Census data for the population totals of each state, and the SNAP characteristics which break down enrollment by state. I chose the 2020 data as I find it more reliable than the American Community Survey (ACS) data to accurately capture the population as a whole.
To determine whether a state was “red” or “blue”, I used the 2016 election data as the FY 2020 data would have been from when Trump was in office for his first term.
By comparing this data, I found this:
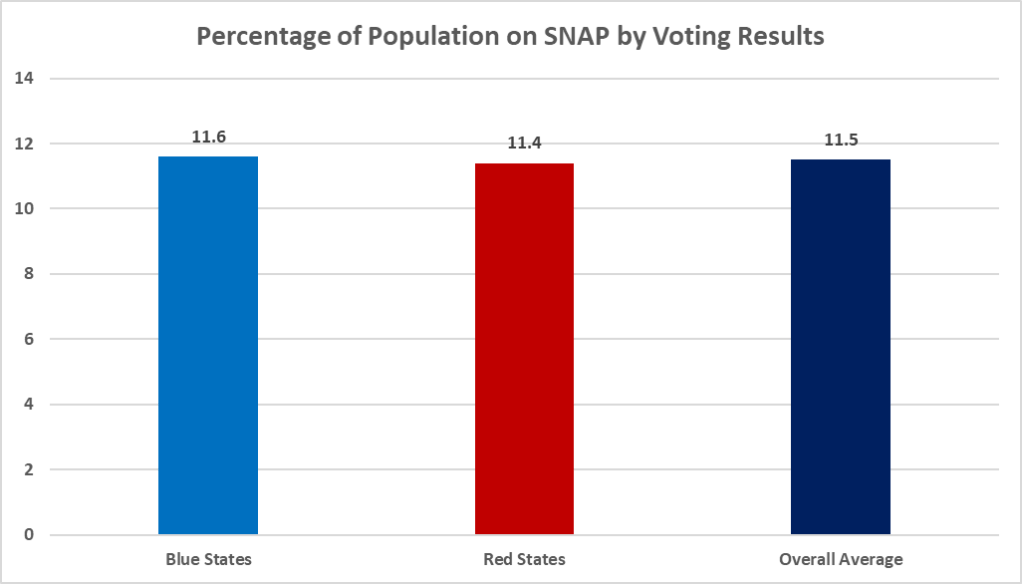
Blue states, on average, do have a higher population on SNAP. By a whopping 0.2%. Considering the overall average, Blue states fall only 0.1% above the line.
I’m going to call this not statistically significant.
Another important point to make here: Minnesota, the “land of the fraud” as Trump would have us believe, only had 7.5% of its population on SNAP as of 2020.
If we look at the population estimate given by the U.S. Census Data in 2023 and compare it to the last available SNAP report from 2023 (they take approx. two years to release, so this year we are likely to get the 2024 report), the numbers shift a bit. 12.59% in Blue States or on welfare, vs. 11.10% in red states. Again, this is based not on a decennial census, but an estimate.
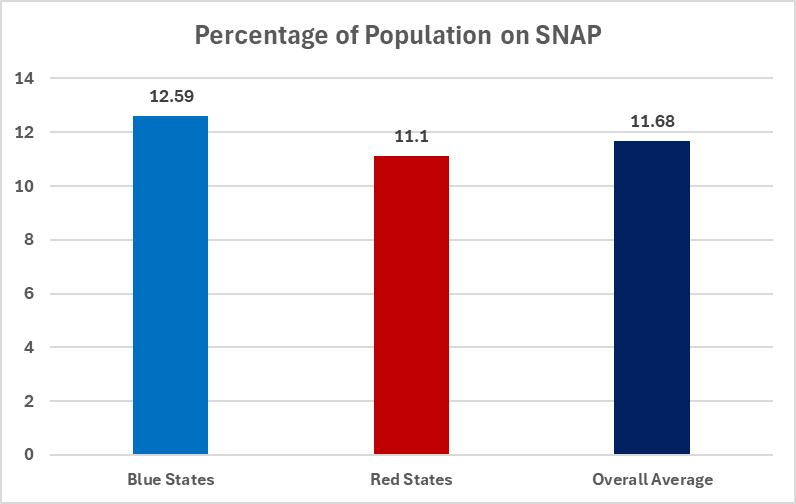
In 2023, Minnesota was still below the average at 8.01% on SNAP.
Another important question – how much is the average participant in each state receiving? Are blue states handing out more per participant on average? Are red states?
Using the same 2020 Census data, the same report and the same election map, here’s what I found:
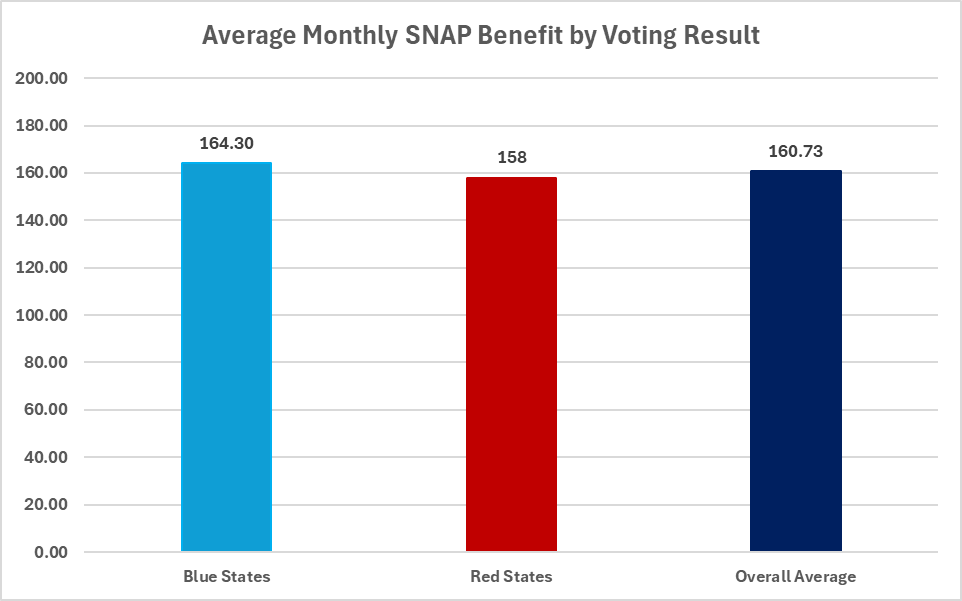
On average, blue states spend about $4 more per person on SNAP than the average, while red states spend $2 less. So yes, blue states do shell out more for SNAP than their red counterparts. Not by a HUGE margin, but there is a difference.
Oh, and MN? MN pays out an average of $156.34. $4 below the average, and $2 below the red state average.
Here’s the same chart from the 2023 estimated population vs. the USDA report:
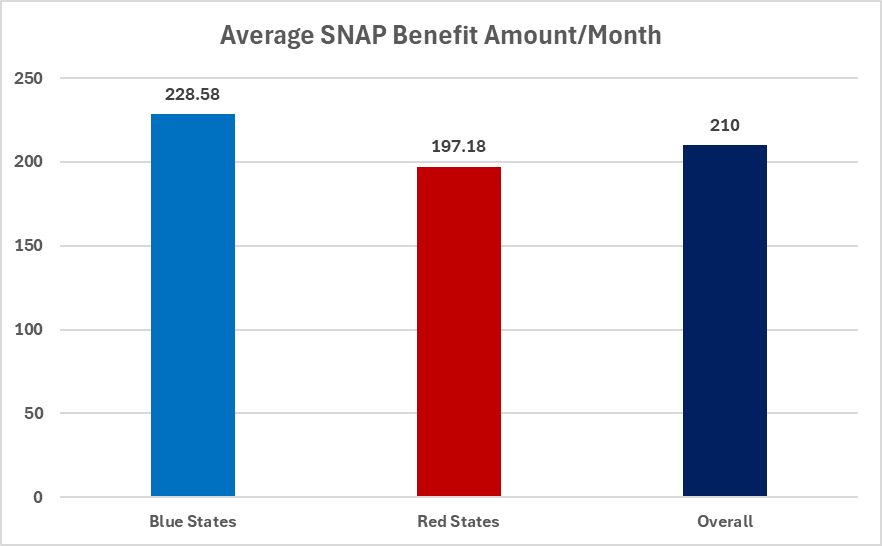
Based on this, blue states were receiving roughly $31/less per person than red states. Minnesota itself saw the SNAP recipient average/month of $242 – $30/month above the average.
So, what’s up with blue states spending more? The cause of this, if I had to speculate, might be cost of living differences.
Let’s test that theory.
Normalizing Results
Time to get crazy. Using the Cost-of-Living Index for groceries by state found from the Missouri Economic Research and Information Center, I figured out what percentage above or below the Cost-of-Living adjustment index each state fell. Here it is:
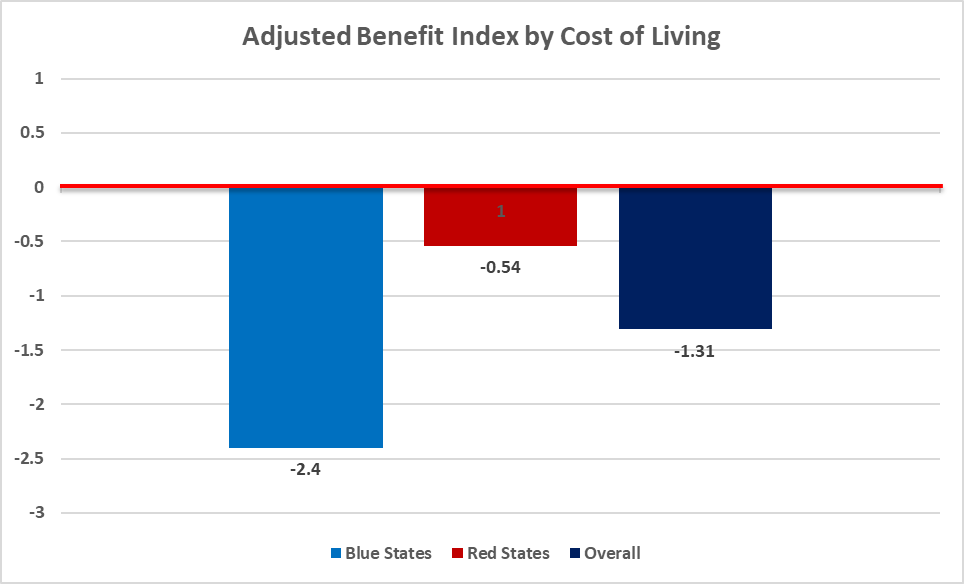
How to interpret this information: The red line is at zero. The value of zero would represent perfect adjustment of the average benefit to meet the state’s Cost of Living index. Anything above that line indicates states getting more than their share of benefits, based on the cost of living there. Anything below the line indicates the opposite: recipients are getting less than their share based on their state’s COL.
Using this, we see that blue states tend to fall farther below the adjustment line than red states. The average of adjustment leans toward states getting less than their fair share if we look at the average of all 50 states.
Repeating the same process for the 2023 average, we see a shift. Blue states fall farther below the line, while red states actually move above it.
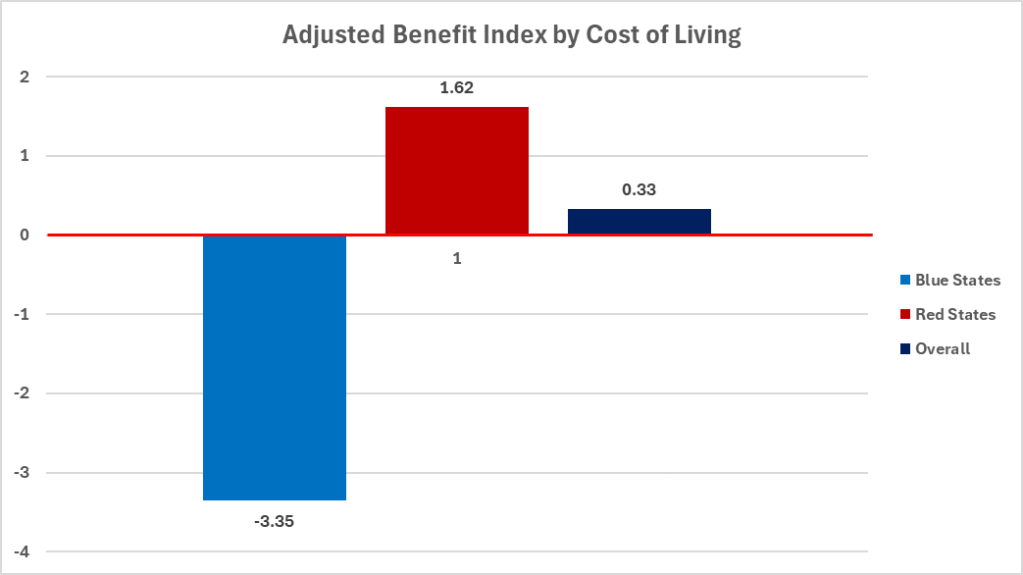
Minnesota’s individual value from 2020 is -3.31%, and 0.34% in 2023.
The TL;DR takeaway: While blue states pay more, they pay less than they do in red states based on cost of living. The SNAP buck goes farther in red states, statistically.
Conclusion
The data don’t lie. Blue states do have more than the average percent of populations on SNAP – by 0.1% in 2020 and 1.5% in 2023 (based on estimated data for the latter). Blue states also pay more per recipient, which when adjusted for cost of living, still falls below the “fair share” line for blue states based on cost of living – and 4% below what red states are getting on average.
Minnesota, though. Minnesota’s average percentage of the population on SNAP fell far below the average in both 2020 and 2023. Based on the cost of living in MN, the recipients here are getting only slightly less than what’s fair with our cost of living. I’m not seeing any significant signs of misuse based on these numbers! Future research will be how much each state pays into taxes, at the state and federal level, to see who is and isn’t pulling their weight.
Thanks for reading, as always!

Leave a reply to Hannah Krebs Cancel reply