“Somali people just come here to live off of the system – they don’t want to work!”
Ah, another refreshingly short-sighted argument I hear quite often about the Somali population in Minnesota, and in the US overall.
My husband and I were discussing Walz and Ellison’s hearing before congress over sushi lunch yesterday (3/4) and out of it came a very interesting question.
How does the Somali population’s usage of SNAP and other social programs compare to other refugee populations?
I wanted to investigate this to see if there really is a higher percentage of Somali people using these programs, and if so, is it staying the same or going down over time?
Let’s do the data thiiiiing!
Setting the Stage
I wanted to start with setting the stage. Imagine for me, if you will, that you have just arrived as a refugee in a strange country with your family. You don’t speak the language. Your professional degree may or may not transfer to the new country, but even if it does, that will take time and so will learning to communicate in the new language.
The country that took you in has extended a hand to allow you escape persecution in their country, and is also willing to extend you social assistance to get you on your feet. Are you saying no to that?
With that in mind, here’s the data.
Data Time!
I sourced this data from the American Community Survey (ACS) data for 2024, 2019, and 2014. I wanted to see the same metrics over time to see if numbers are trending up or down. I looked at the top ethnicities/countries of origin for refugee seekers – Somalian, Hmong, Afghani, Syrian and Venezuelan.
The first item of interest is how long these groups have been in the country. The ACS breaks this down to after 2010 or after, 2000-2009, 1990-1999, and before 1990. This data comes from the ACS table of “Period of Entry“. Unfortunately, the last available date for this data was 2021, so we haven’t seen what the last 5 years looks like.
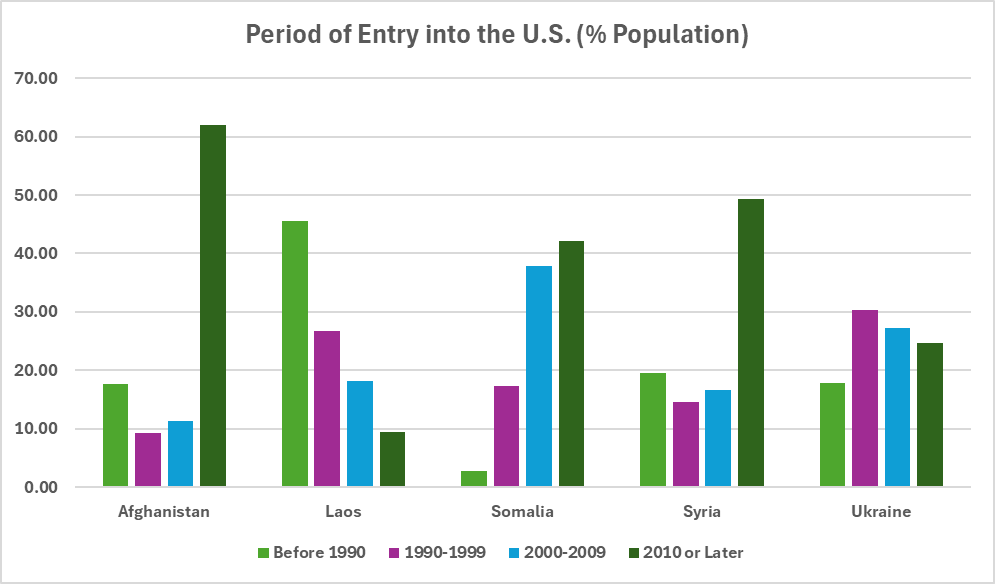
We can see that the Hmong people have been here the longest. The majority of Somalians arrived between 2000-present. Our newest refugees as of ’21 were Afghani, Syrian and Venezuelan in origin.
Next, let’s look at how many of the estimated population came as refugees, rather than immigrants on work, school, or other visas.
Using the Immigration Yearbooks found on OHSS’ website, I found that these were the numbers admitted over time for each country:
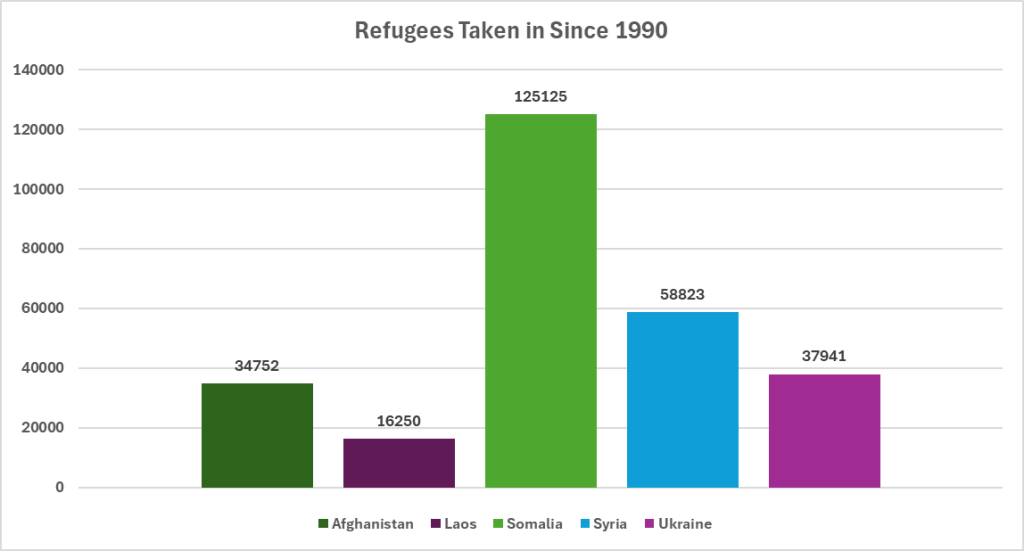
We can see that Somalian Refugees more than double any of the other countries listed. Note, these are only those who came in under refugee status, not any other visas.
So, what percentage of the total population from each county is a refugee vs. a visa grantee? Let’s use Census Data to find out:
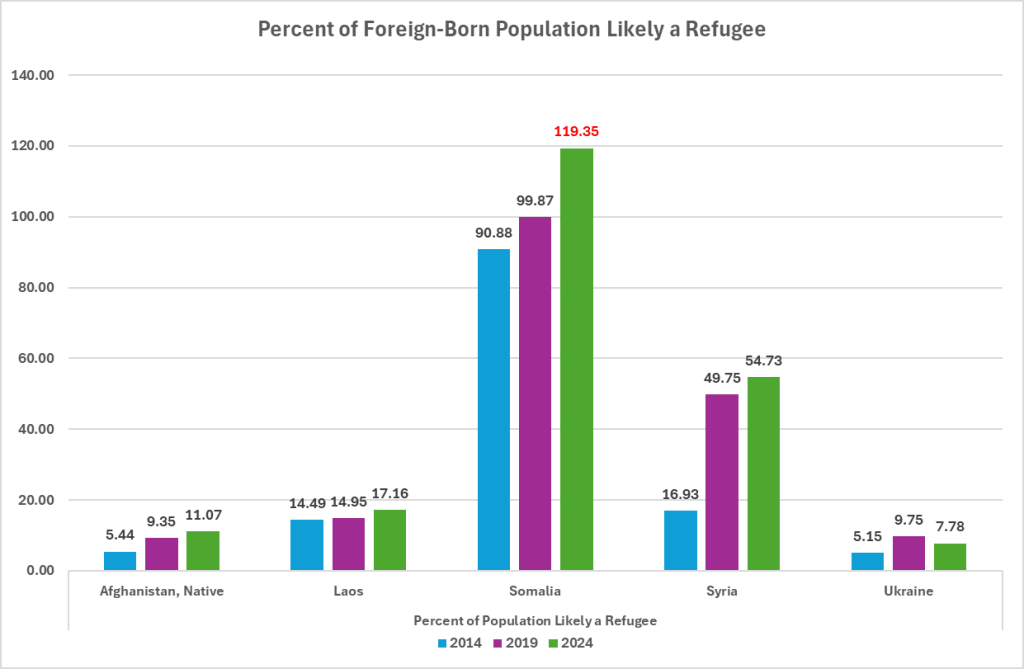
I got these numbers by taking the foreign-born total from each country reported at each ACS census year. I then measured the percentage like this: (Refugee Total Until That Date * 100 / Total Foreign Born Population). You’ll notice that the population of foreign-born Somalians in 2024 is less than the total number of refugees ever received from Somalia. What that shows is that ALL foreign born Somalians here are refugees. In cases like people from Ukraine, they may be foreign born but they only ~7.78 here in the states are here as refugees. This will become important when considering the following charts.
Here are charts showing what percentage of the population is using welfare benefits by country of origin, focusing on SNAP and Medicaid. I also looked at poverty rates. As a reminder, SNAP and Medicaid are only available to non-citizens who meet certain criteria. Refugees must receive their green cards first, which takes a minimum of one year from arrival.
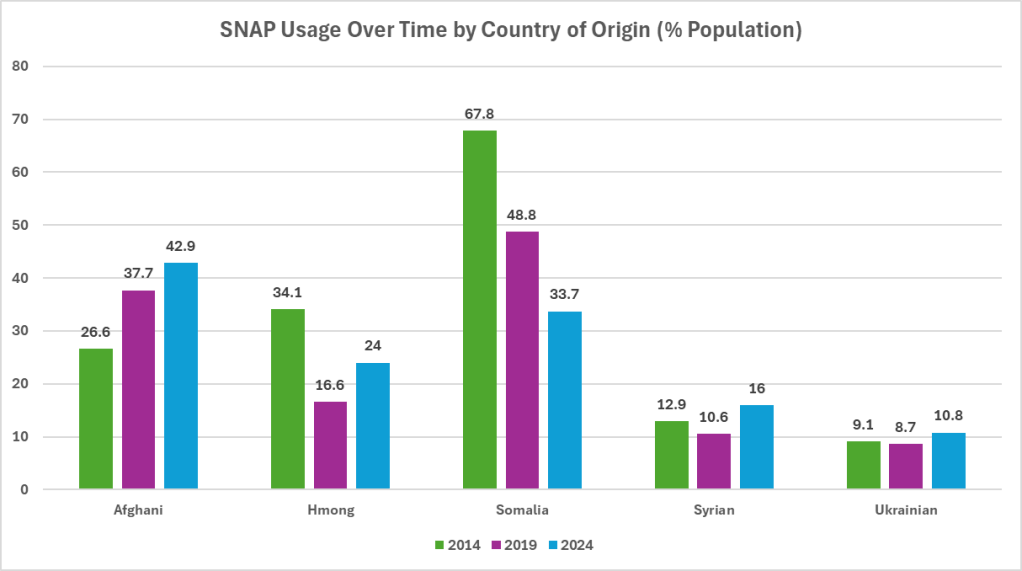
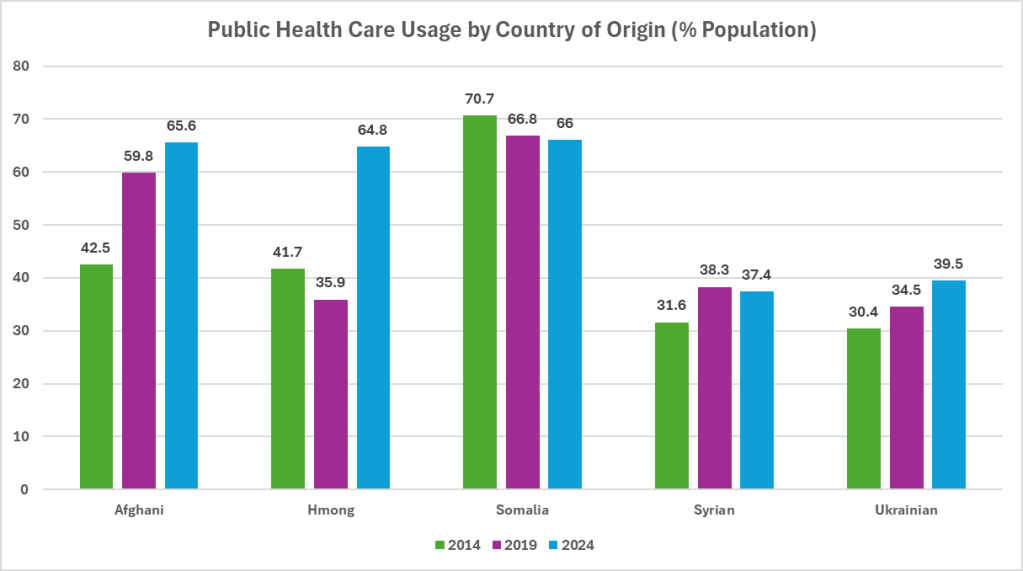
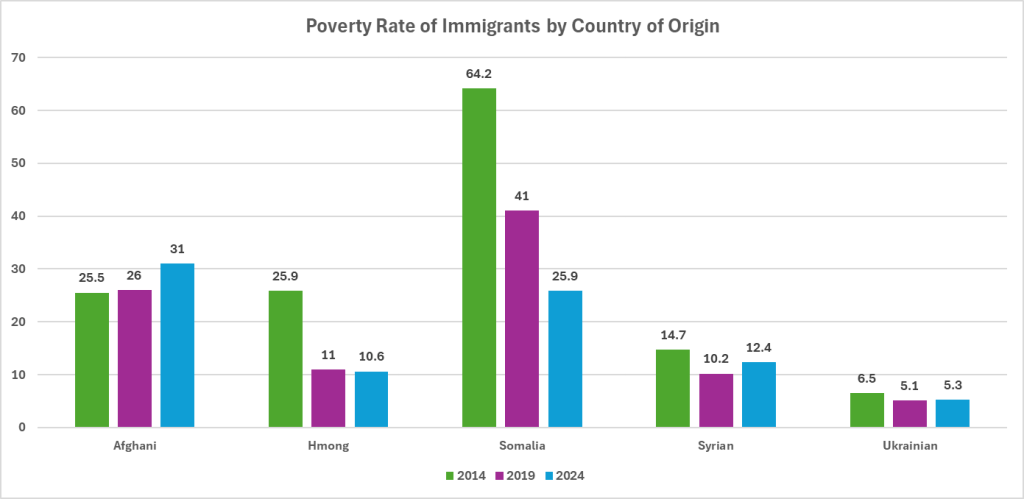
Without question, the Somali people are using the most welfare programs. Interestingly, though, the numbers are RAPIDLY falling for SNAP and the Poverty rate (not as much with public health). Afghani usage is climbing, which is not surprising because we have recently had a huge influx of Afghani refugees (14,680 in 2024). Data is not yet available for 2025 and 2026.
Conclusion
Without even considering other barriers, like professional degree transferability into the U.S., racial or religious discrimination, I think the data speaks for itself.
Considering that the almost the entirety of foreign-born Somalians are refugees, it’s not hard to see why they would be the ones taking advantage of welfare programs. They’re not getting a visa and coming over here for work or school. They’re escaping persecution – in 90% of cases as of 2014 and higher as the years go on. I can see why they’d be likely to need support to get on their feet; they’re arriving completely destitute and starting over.
We can see the numbers climbing for Afghani people – because they are coming over in droves seeking refuge. What we are likely to see with these if we repeat this experiment in 10 years is that Afghani welfare usage peaks, then rapidly falls like we are seeing with Somali refugees.
Thanks for reading!

Leave a comment